DSM: A useful tool for process improvement efforts
Design Structure Matrix, or DSM in short, is a tool I frequently see during my year here at MIT. It is often mentioned in “System Thinking” talks, as well as talks on designing complex system. While the DSM’s uses are many, my project team mates and I focused on process improvement and successfully used the DSM to help our sponsor company improve its processes. Our sponsor company is a aircraft maintenance, repair and overhaul business, and the process we focused on was the aircraft upgrading process, which spans from defining requirements for the upgrade, to drawing out the design, to implementation, to testing and finally to delivery.
How the DSM helped

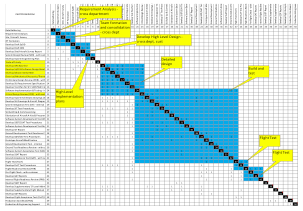
1. Reduce long rework cycles – imagine the nightmare scenario where a project gets to almost completion, and then have to loopback to the beginning for reasons such as a major design error. It is like the chutes and ladders game. The DSM helps to reduce long reworks by reordering the tasks. For example, in our project, initially there were four rework cycles that would set the project back by more than 20 tasks. After the reordering, there were none.
2. Challenge the status quo task ordering, while respecting task dependencies – in the reordered task list for our project, we realized that a number of documentation tasks were pushed to the bottom of the list. These tasks dealt with the development of internal test reports, flight manual and maintenance manual.
Initially, we thought that meant that the company should do those documentation tasks last. However, on investigating further, we realized it was because no or very few other tasks depended on those tasks. We thought about that further, and a revelation hit us: if no other tasks are waiting on those documents to be developed, does that mean that employees could develop those documents late and to the lowest quality but yet not affect the entire process in any way? How can the company ensure the timeliness and quality of those documents? Our sponsor validated that concern, and in the end, we recommended adding sign-offs of those documents to resolve this issue.
This is just one of the many examples. The DSM challenged the status quo task ordering, in a way that respected the task dependencies, so the new ordering still made sense and provided ideas for how the current process might be done better.
3. Facilitate understanding of the current process
The DSM creation process required us to get our hands dirty into understanding the process. We needed to think about what level of granularity we need to get down to, and what kinds of dependencies we should capture. These activities helped us think more about the process, and thus added in our understanding.
In addition, the DSM also provided a visual map of the process. At one glance, we could see which are the tasks that have many dependencies.
Additional Information about the DSM
For readers interested in finding out more about the DSM, I have included some basic information here.
DSM might seem rather technical and intimidating at first glance. And that fear is well justified, as DSMs are matrices, a mathematical artifact that inspire fear into people’s heart by the mere mention of its name. However, if you spend 10-15 understanding how it works, you will find DSM a useful tool to include in your toolbox for process improvement projects.
Creating the DSM
To use the DSM (for the purpose describe in the article), we have to provide three main pieces of information:
1. The list of tasks in the process. For example, in the design phase, creating the high level design would be a possible task, and doing preliminary design review would be another possible task.
2. The dependencies between tasks. This information will specify that for Task A to start, what tasks would need to be first completed. For example, preliminary design review needs to be completed first before detailed design can commence.
3. Possible loopbacks. This indicates scenarios where rework need to happen. For example, after preliminary design review, the proposed design might be deem unsuitable and the project will need to go back to high level design.
These three pieces of information can be visualized in a graph like the following:
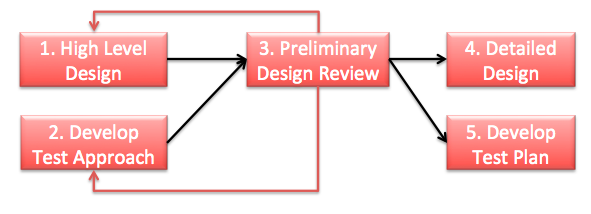
Here, the tasks are represented by the boxes, the task dependencies by the black arrows and the loopbacks by the red arrows. This graph is not needed for DSM creation, but is included here to illustrate information needed to create a DSM.
With the required information, a DSM can easily be created. Using the same example, the DSM will look like this:
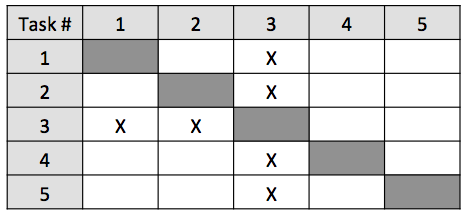
The DSM contains the same information as provided by the graph, but putting it in a matrix allow us to apply some tools that will help in our process improvement task. Then, to do the task re-ordering, you just need to use a tool to “partition” the matrix. Tools, such as PSM 32 and a DSM Excel Macro, can be found DSMweb.org.
Further Readings
- “Complex Concurrent Engineering and the DSM Method” by Yassine and Braha
- “The Model Based Method for Organizing Product Development” by Steven D. Eppinger, Daniel E. Whitney, Robert P. Smith and David E. Gebala.
- “Generalized Model of Design Iterations Using Signal Flow Graphs” by Steven D. Eppinger, Murphy V Nukala, and Daniel E. Whitney.
Credits
This work is not solely of my own. A lot of credits to my team mates Haibo Wang, Davit Tadevosyan and Kai Siang Teo.